Review of sustainable development
Introduction
In the past few years we have noticed an increased focus on environmental, social and governance (ESG) criteria from rating agencies and our investors. These criteria are the preferred means for the financial markets to evaluate companies beyond financial and risk indicators. We were able to answer queries adequately with our existing sustainability data and report.
Value creation model
We use the value creation model to provide insights into our efforts, choices and impacts. It visualises how we create value with our distinct competences, for the environment and the societies in which we operate. It also guides how we report our results.
Materiality analysis
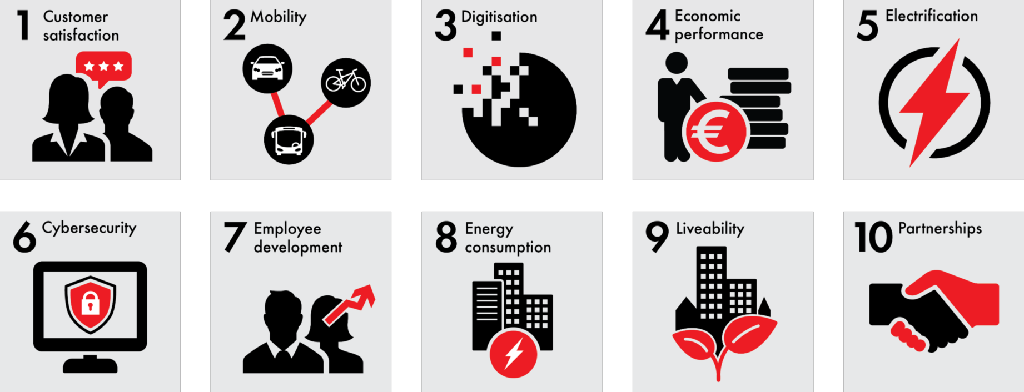
Every three years we conduct a materiality analysis to identify the topics that are most relevant to our stakeholders. The top ten material topics identified in 2020 are customer satisfaction, sustainable mobility, digitisation, economic performance, electrification (EV charging and EV fleet), cybersecurity, employee development, energy consumption, urban liveability and strategic partnerships.
Figure 4 Top ten material topics
Key results summary
We report our results over 2022 and where we have data available of previous years, we show comparable results.
Customer satisfaction is measured by monitoring the average score of Google reviews. We have an average score of 3.6 (on a five-point scale), generated from 14,846 reviews (2021: 12,631).
Sustainable mobility services include transforming search traffic to destination traffic and is enhanced with:
476 PFs offering online pre-booking (2021: 385), an increase of 24%;
286 PFs near public transport hubs (2021: 212) an increase of 34%.
Digitisation is about expanding our smart back-office systems and business intelligence instruments to improve informed decision making, providing more online information and enabling pre-booking solutions at more PFs for our customers. We continue to move forward in digitising our business, our partnerships and customers' journeys.
A key aspect to optimising digitisation is unlocking PFs with automatic number plate recognition (ANPR) via our proprietary platform PaSS:
PaSS enabled PFs increased from 204 (2021) to 368 (2022).
Electrification for us means significantly increasing the number of EV charging points installed in our PFs, serving the ever increasing customer base driving electric vehicles. We now have:
2,831 EV charging points (2021: 2,114), an increase of 34%;
235 PFs offering EV charging (2021: 227), an increase of 4%.
Chart 1 Parking facilities offering EV charging
Chart 2 Total EV charging points
Our Cybersecurity Awareness Programme was rolled out in 2019 and remains active and relevant in 2022. It includes online training, with 92% of all employees having completed the e-learning programme. During 2022 we have had no cybersecurity breaches and no data incidents.
Our overall employee development is expressed by the number of employees receiving regular general training (2022: 1,545 compared to 2021: 1,394, an increase of 10.8%).
The total energy consumed in our owned and long-leased parking facilities (O+LL PFs) amounted to 94.6 GWh compared to 100.6 GWh in 2021, a decrease of 6%. This includes the energy consumed by the increasing number of EV charging points in our facilities (7.8 GWh in 2022 versus 5.5 GWh in 2021).
Chart 3 GWh consumed by O+LL parking facilities
From a liveability perspective our key contribution is reducing our carbon footprint. Our carbon footprint per parking space in owned and long-leased parking facilities (O+LL PFs) is much lower compared to 2021.
The average kgCO2 per parking space is 45.8 (2021: 93.2), a considerable decrease of 51% mainly thanks to green energy sourcing and the CO2 certificates purchased.
Since we started measuring our emissions in 2010, we have already achieved a 74% reduction in our carbon footprint per parking space.
Chart 4 Average CO2 footprint (kg CO2) per parking space - market based
It is important to note that during 2022 we made some improvements regarding how we calculate and publish our carbon footprint.
We use energy consumption from our measured Owned + Long-Leased parking facilities (O+LL PFs), and extrapolate to derive the total energy consumed by our entire O+LL PFs portfolio.
We use energy consumption from our measured EV charging points and extrapolate to derive the total energy consumed by all our EV charging points.
We deduct the energy consumed by our EV charging points and their carbon footprint respectively, as this impact belongs to our downstream value chain. This is now attributed to Scope 3.
In 2022, we engaged in more strategic partnerships than ever before. For Q-Park, a strategic partner is one who enhances sustainable development in urban areas and who complements our assets, capabilities and/or expertise. Our new partnerships include:
Public landlords developing off-street parking to reduce on-street parking, thereby opening up space for pedestrians and cyclists.
Private landlords who repurpose PFs from private to public, thereby decreasing the need for construction work, and all the inconvenience this causes while increasing the life-span and usage of existing assets.
Public transport partners who nudge customers to park their car at convenient locations, often at the edge of the city e.g. P+R, and use public transport for part of their journey.
Partners who support us to develop mobility hubs with fast-charging.
Logistics partners who use PFs as a base for last mile delivery and/or storage services.